Orders Report – My First Looker Dashboard
A clean and interactive Looker dashboard showcasing order trends, customer segments, and product categories across regions.
July 2025
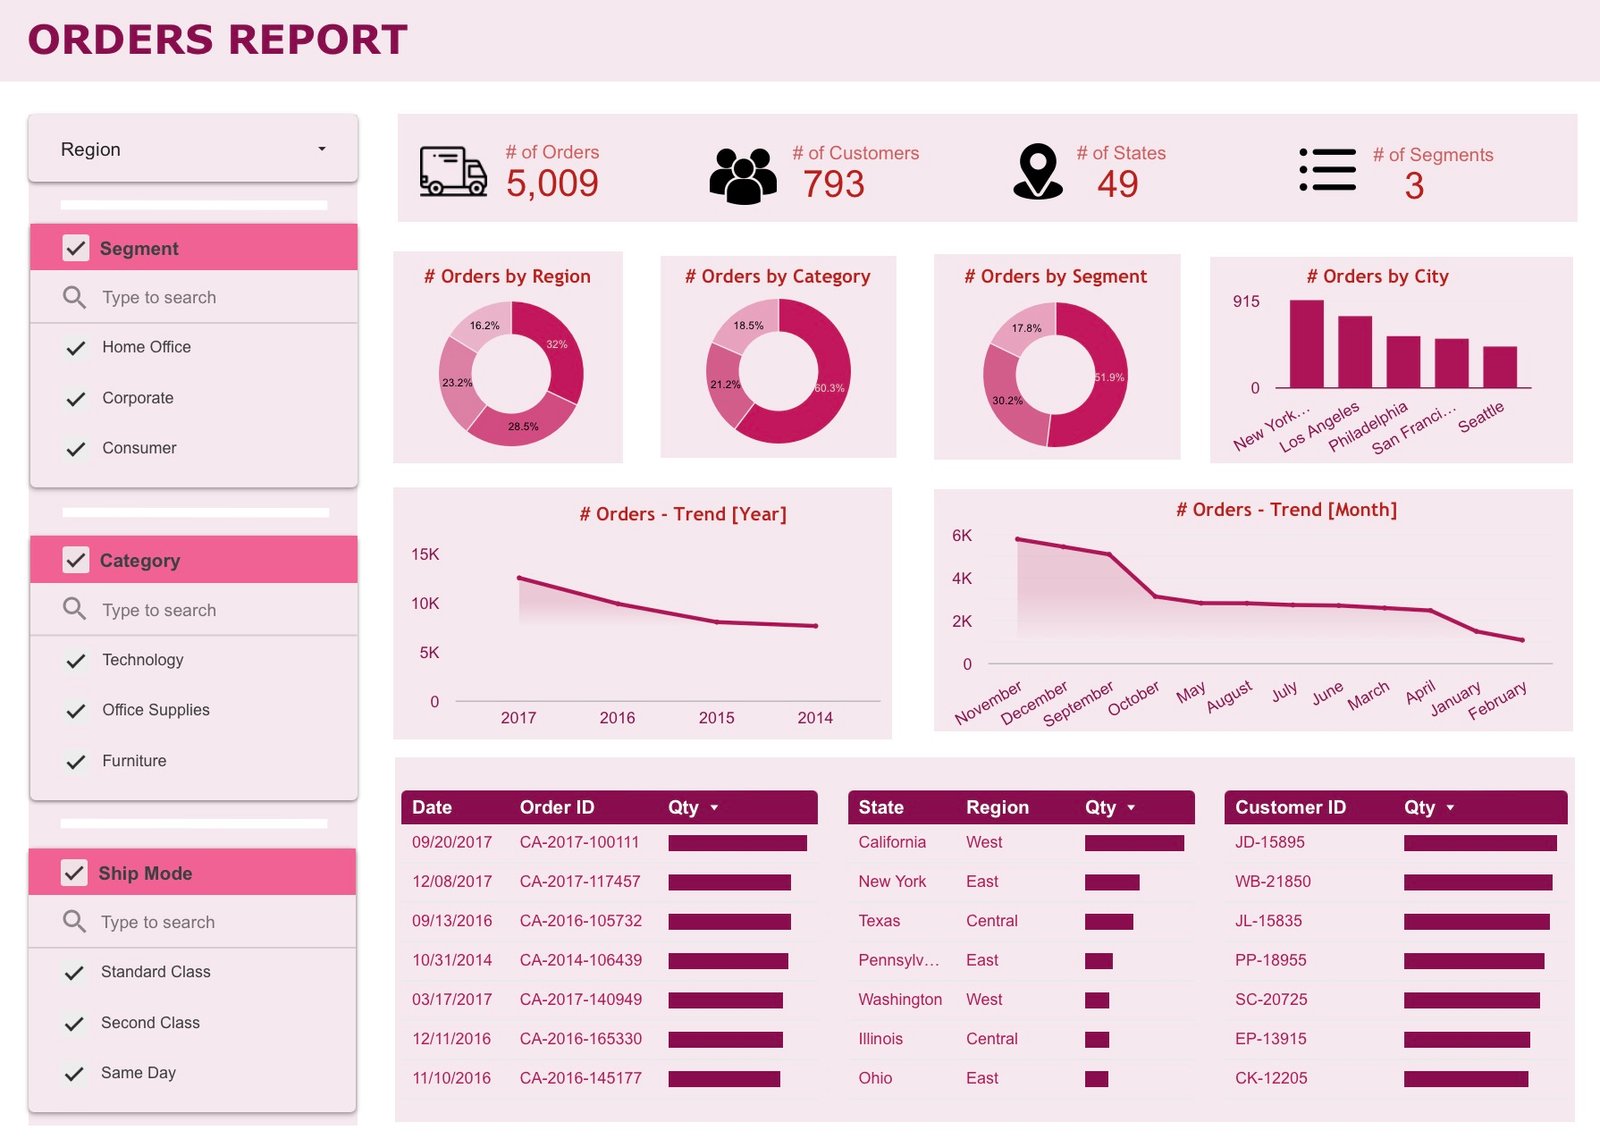
This is the first interactive dashboard I built using Looker Studio. It visualizes order volume across different customer segments, product categories, regions, and time periods.
As I begin my journey with Looker, I’ve found it refreshingly intuitive — significantly easier to use compared to Power BI and Tableau, especially for building quick, clean, and shareable dashboards.
Key features of this report include:
- Dynamic filters by region, segment, category, and ship mode
- Visual breakdowns by city, year, and month
- Interactive charts with order and customer insights
View the interactive dashboard here.